Time to depth conversion
Description for this block. Use this space for describing your block. Any text will do. Description for this block. You can use this space for describing your block.
All sources of Uncertainty included
- Time
- Depth
- Velocity (local/trend)
Velocity model uncertain itself (as if Base Case was simulated itself)
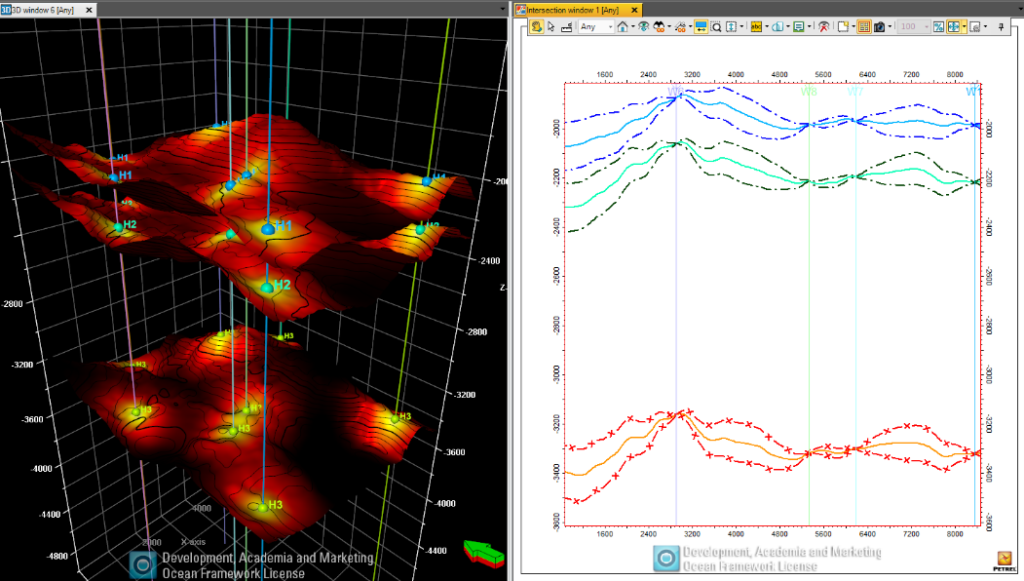
Explore hundreds of realizations to answer nonlinear question (Reservoir geometry, Volume, P10/P50/P90, etc…)
The stochastic time-to-depth conversion yields hundreds of realistic depth maps which are all consistent with the time interpretation, velocity constraints and picked formation tops. Thanks to its integrated, ensemble-based approach, Udomore also enables the use of advanced constraints for filtering the depth maps created. Three main types of advanced filters can be associated with the depth conversion: trap success, spill depth, segment connectivity and segment size. Furthermore, a “best-case” depth scenario can be derived from the set of filtered realizations, ensuring optimal consistency with existing petrophysical, production and testing data
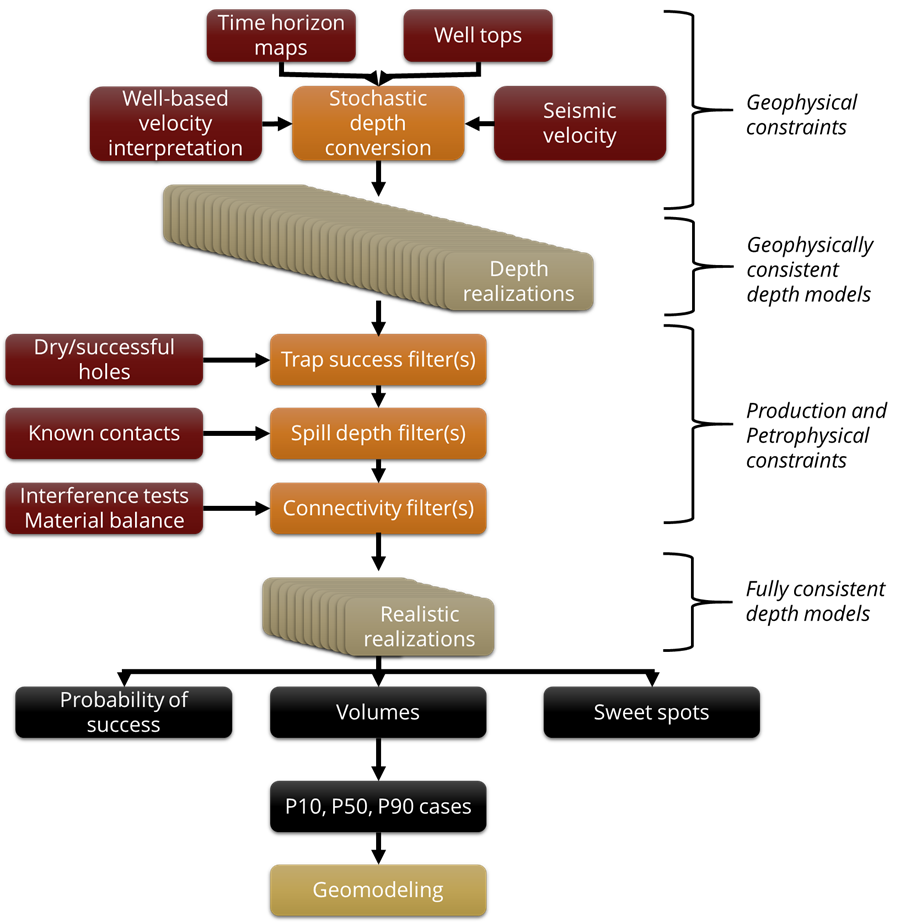
Trap success
Depth realizations corresponding to successful (or failed) structural traps for a given set of targets (e.g., existing or planned wells) can automatically be identified and retained (or filtered out). This also allows assessing “success case” volumetrics.
Spill depth
When hydrocarbon-water contact depth is known from existing well penetrations, the depth realizations can be filtered based on their consistency with this information. When such filter is used, stochastic realizations such that the automatically computed spill point is shallower than the known contact depth are excluded from the list of depth realizations. This ensures that only realizations which are fully consistent with all available fluid data are used for risk and volume assessments
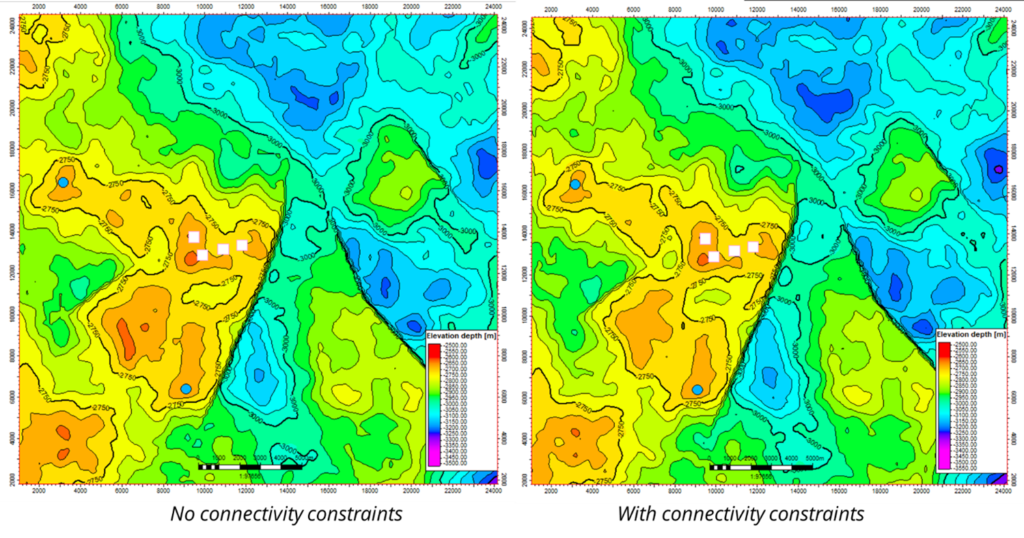
Segment connectivity
The connectivity between various hydrocarbon accumulations can also be quantified and used for filtering the list of stochastic depth realizations. This is useful when advanced data (tracer or interference tests, material balance analysis) is available to further constrain the depth conversion and structural modelling process. When such data is not available, the probability of connectivity between hydrocarbon accumulations can be estimated from the obtained surfaces.
Segment size
Finally, different filters (area, column height, gross rock volume) can be applied to retain only the depth realizations which are consistent with test or production information. When maps cover different hydrocarbon accumulations, such filters can be applied and combined with other advanced filters for retaining only the most consistent realizations in depth domain. This unique ability to integrate interpreted production and reservoir engineering data in the depthing process is a key advantage for creating consistent subsurface models.
Prospect assessment
Udomore quantifies the probability that structural traps are closed (no spill), and that planned well targets are located within a structural trap. This is a key element when computing the probability of success of leads and prospects. Thanks to its ensemble-based approach, Udomore simultaneously performs the assessment by running a spill analysis on hundreds of equiprobable realizations of depth maps, accounting for uncertainties on the velocity, the time interpretation and the velocity field. Fault polygons, existing successful/dry holes and information on the connectivity of accumulations are all accounted for, and multiple prospects can be assessed automatically at once.
The process yields a probability of success for the trap component, and allows identifying the “success case” realizations, which are later used for spill point analysis and volume calculation.
Udomore automatically performs ultra-fast spill point analysis on multiple stochastic realizations at once, enabling detailed analysis of spill depth and prospect contour uncertainty. Using fault polygons, three-way closures and downthrown-block prospects can be identified and contoured.
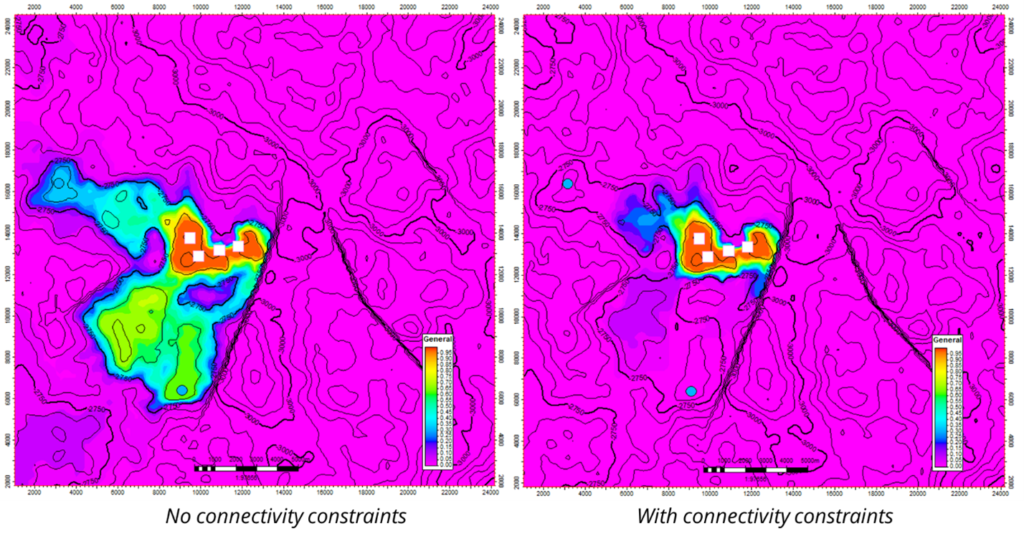
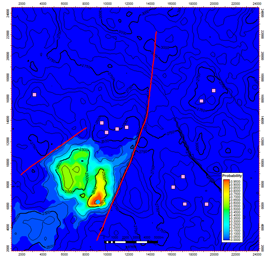
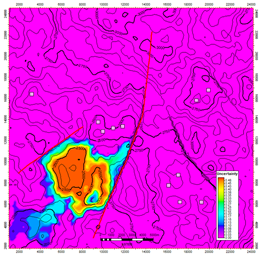
Udomore produces maps depicting the probability of presence of each prospect. Furthermore, Udomore can automatically report the probability that several accumulations are connected as part of the spill analysis.
For each of the stochastic maps, the identified spill depth can then be used for constraining hydrocarbon contact depth simulation and therefore volume calculations and sweet-spot analysis.
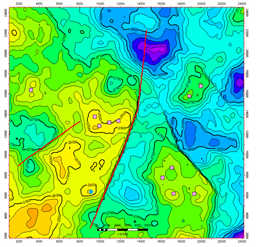
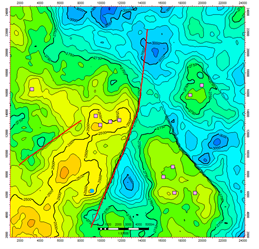
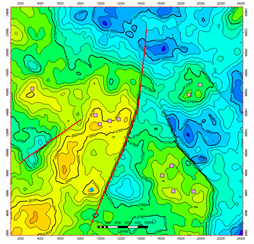
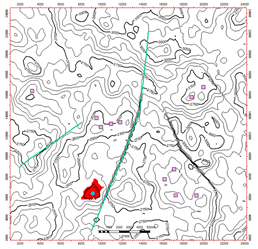
Examples of stochastic realizations produced by the depth conversion process:
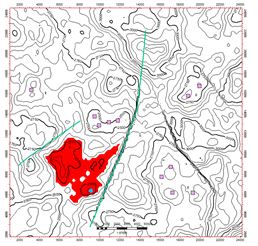
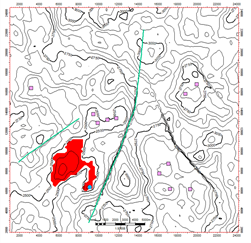
Probability of prospects:
Description for this block. Use this space for describing your block. Any text will do. Description for this block. You can use this space for describing your block.